How do you determine if your sales team is on the right path? Analyzing and monitoring the right data can help your sales reps course-correct and improve.
Sounds great, but what data should they focus on? Sales report templates are useful for that. They outline the important goals, sales pipeline, and help you determine which potential leads are converting at the best rates. Essentially, regular reporting aligns your sales activity with your sales strategy.
- Why is sales reporting important to your business?
- What are some important KPIs for sales reporting?
- What are the key elements of a sales report?
- How to make sure your sales reports are effective?
- How to write a sales report?
- Sales report examples and templates you can use
- Remember the Purpose of a Sales Report Template
- How To Improve Your Sales Reports with Dooly
Why is sales reporting important to your business?
A company’s profit engine is its sales department. A sales report is important because it highlights your company’s sales operations and helps align the goals of your team and the company as a whole. A sales report template will commonly include data on current volume, new sales leads, new accounts, income, and costs.
Such reports assist various departments in understanding priorities and developing strategies to achieve the company’s overarching objective. You’ll know where to double down and where to improve if you know what’s working and what’s holding you back.
A good sales report can enable managers to identify problems at the right time and refine strategies to meet their quota. Furthermore, the company’s executives base their decisions on high-level sales performance.
Finally, a sales process that gives you the freedom to sell.
Build a repeatable, winning sales process with Dooly's powerful note templates.
Try Dooly for free
What are some important KPIs for sales reporting?
A key performance indicator (KPI) or sales effectiveness metrics are performance measurements used by sales managers to track the effectiveness of a company’s sales activities. Modern sales teams are driven by a common goal (or sales KPI).
The KPIs you select will be determined by your business model and goals. That being said, here are some common sales KPIs to include in your sales report templates.
1. Trials
Trials are a useful KPI, particularly in the SaaS model. It counts the number of accounts that begin within a specified time period. If marketing can generate a large number of leads, sales can use that volume of leads to qualify and eventually close them.
2. Sales Qualified Leads
These leads are identified as Marketing Qualified Leads before becoming SQLs. However, they become SQLs once they meet certain conditions set by the sales team. These are leads who intend to make a purchase.
3. Sales cycle length
This is the average amount of time between meeting a prospect for the first time and closing the deal. This sales KPI supports you in deciding how long it takes to convert a lead into a customer and how efficient your sales process is.
4. Average cost per lead
Simply put, this KPI indicates how much it costs the company to generate one lead. This metric is directly related to the cost of acquiring new customers. The most precise average cost per lead KPI takes into account all marketing expenses to gain potential customers.
5. Sales growth
This KPI, as the name implies, tracks sales growth, and thus the growth of your company. It’s a great way to see the rate of your company’s growth.
6. Revenue per sales rep
This KPI allows you to monitor your team’s progress. Revenue per sales rep as a metric also allows you to see if your team’s results are consistently growing or not, as well as outline the types of targets you should set and reach.
These are just some of the many important KPIs for sales reporting. Knowing your KPIs will allow you to pick the right sales report template.
What are the key elements of a sales report?
The formats and metrics of various sales report templates vary. However, there are some key elements that should be present in every sales report. These are some examples:
1. Outline and objective
It is critical that your manager understands your report even if you are not present to explain it. As a result, when creating a sales report, include an outline and objective at the start so the receiver understands why the report exists and what to expect from it.
2. Short summary
The length of your summary will be defined by the template for your sales report. A weekly report may only demand a paragraph, whereas a monthly report may involve more detail. A good summary should cover the important information and provide insights and recommendations based on that information.
3. Section breakdown
Sectioning your report makes it easier to understand and digest. For example, you can divide your report into two sections: overall sales revenue and client profile. Other sales KPIs, such as sales ratios, client lifetime value, and profit comparison, can be used to complement your narrative.
4. Interpretation and recommendation
This section deduces interpretations from data and explains what all the numbers mean. You can highlight any specific jump or hit in this section and explain what caused it and what you can do about it. A marketing campaign, for example, may have resulted in an increase in sales leads during a specific time period.
How to make sure your sales reports are effective?
Effective sales reports do more than just dump data on paper. Consider the following to ensure the effectiveness of your sales report:
- Have a clear goal in mind so that you can collect and analyze the appropriate data.
- Determine who will be reading the sales report so that you can highlight the points that are most important to them. A marketing manager, for example, would want to know which marketing campaigns contributed to the most profitable sales.
- Incorporate goal-oriented data. Add metrics like sales growth, regional sales, new opportunities, and team performance, for example.
- Extract useful numbers and use graphs and charts to visually illustrate your data.
- If you don’t have a set format, consider using sales report templates that you can customize to your specifications.
How to write a sales report?
Writing a sales report that communicates the right data in an engaging format is an art that proves your understanding of your data. Here are some things to consider when writing a sales report.
1. Know your audience
Defining your target audience will help you identify what information to include in the report that will be useful to them. For example, executives want to see the big picture, but your team wants a more detailed report on how their sales activities performed.
2. Collect the right data
Knowing your target audience will enable you in gathering, filtering, and analyzing the relevant data. Executives, for example, would like to know the overall sales growth and cost of customer acquisition. A marketing executive, on the other hand, would be interested in how their marketing campaigns performed in the current period compared to the previous.
3. Create the right visuals
Tables and number tables are tedious. Use visuals to make your sales report more interesting. Line graphs, for example, can be used to show growth or decline. Pie charts can be used to highlight customer personas. Bar graphs are used to compare the performance of various team members.
4. Keep it concise (no fluff!)
The key to creating a great sales report is knowing what to discard. Knowing your audience and their goals will help you in carefully choosing what to highlight in the report. Executives, for example, will be more concerned with the end result than with the process. Use visuals and bullet points to keep your report concise.
Sales report examples and templates you can use
Daily Sales Report Templates
A daily sales report template can be used to highlight the most important daily sales data, such as the number of closed deals, client conversations, new opportunities, and so on. A daily template focuses on the day-to-day process rather than the end result.
Weekly Sales Report Templates
A weekly sales report template can assist you in gauging each sales rep’s performance improvement. Sales KPIs such as sales volume by channel, lead-to-opportunity ratio, lead conversion ratio, the total number of outbound calls, and upsell and cross-sell rates can all be found in a weekly sales report.
Monthly Sales Report Templates
A monthly sales report is used to monitor, evaluate, analyze, and determine sales trends on a monthly basis. It focuses more on long-term measurement of KPIs such as monthly performance reports, conversion reports, sales activity, sales cycle length, revenue, profit, and more. These metrics are important to track on a monthly basis as they can change the course of your business or sales strategy. Use this monthly sales report template to help you.
Annual Sales Report Templates
Annual sales reports are used to gauge sales performance and the effectiveness of sales strategies. It gives an overall picture of a company’s growth in the current year compared to the previous year. Sales cycle, sales growth, and cost of customer acquisition are some of the metrics that you could include in this sales report. It would probably be helpful to break it down into quarterly sales metrics for easier review.
Remember the Purpose of a Sales Report Template
The purpose of a sales report template is to:
- Measure KPIs against company objectives and sales goals
- Keep a track of highs and lows to determine the growth strategy
- Understand what works and what doesn’t so you can focus your energy in the right direction
Sales report templates give you an outline of what kind of data to look at and how to highlight it in the best possible way. Knowing where to start can set you on the right path, improve your decision-making, and help your business grow.
How To Improve Your Sales Reports with Dooly
To pull these sales reports, you need your data to be updated and all mandatory fields in your CRM to be filled out.
But we all know that updating the CRM is not a priority for most sellers (it’s time consuming and takes them away from actual selling activities). That’s why Dooly exists.
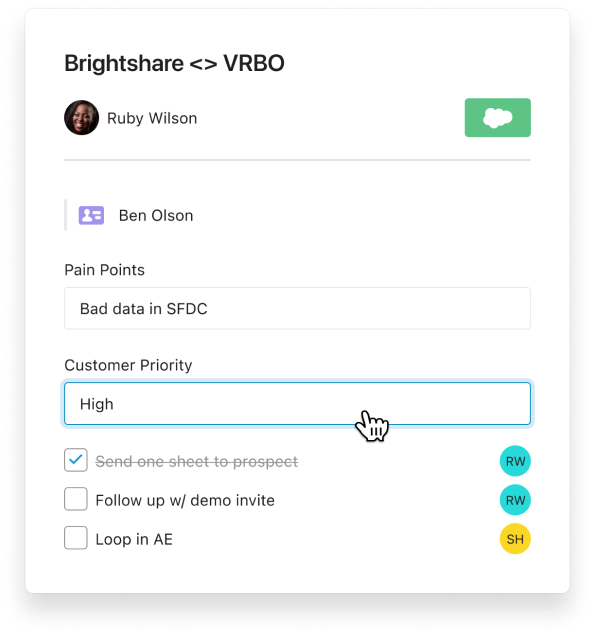
Dooly syncs your meeting notes to Salesforce automatically so you can spend more time selling. And it lets you add Salesforce fields directly to your notes so you only have to update them once. See Dooly in action.
With Dooly, you can also take control of your pipeline. Dooly helps you manage all your deals at once with one-click updates from a centralized view. And an updated pipeline means more accurate sales reports.
Join the thousands of top-performing AEs who use Dooly every day to stay more organized, instantly update their pipeline, and spend more time selling instead of mindless admin work. Try Dooly free, no credit card required. Or, Request a demo to speak with a Dooly product expert right now.


