Although it can be intimidating, a sales forecast is simply an expression of the current and future condition of a company, essentially where you are and where you want to be. As a result, you can think of a sales forecast not only as an analytical tool but a chief motivator, too.
Unfortunately, a large chunk of sales forecasting is just plain wrong, relying on incomplete data or using poorly-optimized formats. In such a case, getting your hands on sales forecasting templates can save you from making these common mistakes, giving you a forecast to feel confident about.
So let’s have a quick look at the purpose of sales forecasting, some inner workings, and the principles you can follow to improve those spreadsheet skills (plus some great sales forecasting templates to download).
- What Is Sales Forecasting?
- How to Forecast Sales
- 1. Qualitative Forecasting
- 2. Quantitative Forecasting
- Why Sales Forecasting is Important
- How to Create a Sales Forecast
- Guidelines for Creating a Sales Forecast
- Factors That Can Impact Your Sales Forecast
- 9 Best Sales Forecasting Templates
- Key Takeaways on Sales Forecasting
- How Dooly Can Help with Sales Forecasting
What Is Sales Forecasting?
Sales forecasting is an estimation of sales revenue within a certain timeframe. In much the same way weather forecasts have varying degrees of accuracy, a sales forecast can only ever be a prediction of how well a company may perform in the next week, month, quarter or year.
How to Forecast Sales
Traditionally, there are two types of sales forecasting: qualitative and quantitative. The former relies on expert opinions, while the latter depends on historical data of an earlier sales process.
Finally, a sales process that gives you the freedom to sell.
Use Dooly to keep your deals on track, and your manager off your back.
Try Dooly for free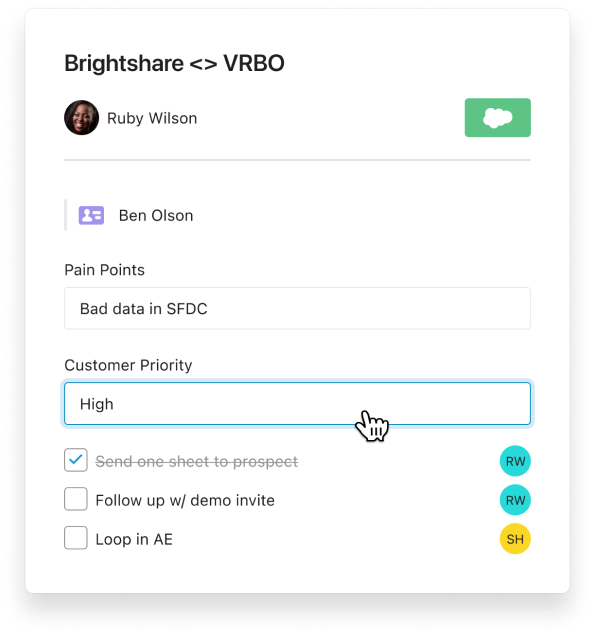
1. Qualitative Forecasting
It’s not always possible to look back at an expansive amount of data, hence the need for a qualitative approach. In this kind of sales forecasting, a sales team will use their specialist knowledge to analyze the past operations and projections of comparable companies. These industry experts will undertake extensive market research, which will include consumer surveys and employee polling. In doing so, they can create an informed prediction on future sales revenue along with the growth rate.
2. Quantitative Forecasting
When a company already has a track record, that data can be leveraged for a quantitative sales forecast. This is also called “historical forecasting” because it is used to make informed decisions based on past results. As long as sales metrics are used (attainment, contract value, deal cycle, CRM score, etc.), the forecast can be quantified, and is thus unbiased. The most basic method is linear extension, which looks at the revenue increase or decrease across a shorter period of time and applies it to the next sales period. For longer time frames, linear regression is preferred.
Though both types of sales forecasting are implemented to predict future revenue, quantitative measures are generally seen as more reliable. However, you cannot really compare the two methods fairly as they are fundamentally distinct. Companies may see the best results by having an integrated approach to their forecasting strategy.
Why Sales Forecasting is Important
Just as a weather forecast can keep you from getting rained on, a sales forecast allows a company to make better predictions. This applies to not only formulating sales quotas, but also allocating resources and establishing best practices.
When a company has an ‘accurate’ forecasting strategy, which simply means it works to a consistent level of accuracy, they are infinitely better equipped than competitors who lack such sales tools. As Alexander Graham Bell said, one would imagine on his newly-invented telephone, “preparation is the key to success.”
Proper investment into sales forecasting allows a company to make informed decisions, as opposed to treading somewhat blindly through the fiscal year. After all, if you can’t measure your growth, it’s much harder to catch early warning signs, keep sales activity on track and ultimately value the company.
How to Create a Sales Forecast
In the simplest form, a sales forecast can be done through the following steps:
- Compile a list of the goods and/or services to forecast
- Estimate the sales volume of those goods and/or services
- Multiply this estimate by your unit price to calculate revenue
- Multiply the same volume estimate by cost price to calculate costs
- Subtract cost from revenue to calculate profits
The trick lies in step 2, estimating how much of something you will sell. This is where past data proves invaluable, but it also helps to use qualitative techniques such as the bottom-up sales force composite method. In any case, you’ll find this universal framework across all kinds of sales forecasts.

Guidelines for Creating a Sales Forecast
By definition, sales forecasts are imprecise. They’re your best attempt to predict the future, a corporate crystal ball. With that said, there are a few principles that give you the best chance at the right answer:
1. Clearly Define Goals Behind Forecasting
A young company dealing with new logos will take a different approach to their sales forecasting than an industry leader. Consequently, certain sales forecasting models and templates prove a better match for select companies. Taking the time to first acknowledge your key sales goals lets you determine the most relevant sales metrics to use in forecasts.
If you aren’t sure of your objectives, it’s all too easy to end up using inefficient or ineffective methods, which could then lead you down the dangerous assumption that sales forecasting is unnecessary or useless.
2. Be Accurate from the Get-go
Less than 50% of sales leaders and sellers have high confidence in forecasting accuracy, according to Gartner. This is probably because a sales forecast is often doomed from the start. The trick to forecasting is accuracy, and the trick to accuracy is data. If just half of your sales teams update their CRM records 50% of the time, you’ve got a quarter of the data you need for true accuracy. And in real-world situations, data can be submitted incorrectly or sent to the wrong place, leaving you with even less to work with.
The solution is not to force sales reps to spend more time inputting data (that is an admin activity that will take them away from the main reason you hired them for: selling). That’s why Dooly exists, to help sellers sync their notes and update Salesforce fields automatically, saving time and making sure all the data you need for sales forecasting is in the CRM.
Using Dooly gives you a better dataset, which in turn may allow you to create far more accurate sales projections. It’s also important to regularly review forecasts by carving out a set time every month.
3. Choose the Best Forecasting Method
As mentioned, quantitative measures are a brilliant basis from which to create your sales forecasts. However, you can use your historical data in various ways, and thus come up with a few different kinds of forecasts. Here are just a few examples:
- Historical Forecast: If you’ve just come out of a profitable month, you can apply that success to your next sales period. Say, for instance, you’ve seen monthly sales valuing $200k. The simplest thing to do is to forecast this for the month. However, you can create a more sophisticated forecast by using further data, like measuring the sales of the same period in the previous year, or the previous 3 years. You can incorporate growth into your estimates, also. If you’re seeing a 3% rise in sales month on month, you can add another $6k to your prediction.
- Opportunity Stage Forecast: When you break your sales funnel down into smaller stages, it can give you some indication of how likely you are to close a deal at specific points. Using past leads to give you some indication on success rate, you can forecast future revenue. Let’s say that last year, the fourth stage of your sales pipeline is where 75% of leads became customers. You can now take that data and apply it to the coming year. Calculating the number of current leads at the relevant pipeline stage by your historical win rate (and then by average deal size) allows you to come up with a decent sales forecast.
- Regression Analysis: Regression analysis is when you use an independent variable (e.g. number of sales calls) to forecast the dependent variable (e.g. sales volume). The assumption is that the second causes the first, which in our example would mean a higher number of sales calls equates to greater sales volume. You can use all kinds of metrics and it’s also possible to model the relationships or numerous independent variables. Regression analysis is a fantastic way of determining the major factors that influence your success.
The best forecasting method depends on the situation, such as the age of a company as well as the scale of their operation. It’s also important to note that different methods work within varying degrees of accuracy, subject to a whole host of external factors. It may be helpful to look over some sales forecasting templates.
4. Use Multiple Sales Forecasts Together
No one said you couldn’t have your cake and eat it, too. Employing multiple kinds of sales forecasts can create better predictions. If you sell a great deal of products, you’ll probably make a forecast using larger categories. However, you’ll of course be interested to track how new products are affecting revenue, in which case you may create specific forecasts.
Similarly, an annual forecast gives you an impression of where you’re heading, but month-by-month updates give you an ever-increasing amount of data for more realistic estimates. While there’s technically no limit to how many sales forecasts you use, there’s no benefit to going crazy with it. Implement the handful of forecasting methods that give you a clear vision of how you’re performing, and no more.
Factors That Can Impact Your Sales Forecast
Basic sales forecasting operates in a highly idealized world, where the numbers are whole and business is good. In reality, there are numerous factors that can affect your success, and thus the reliability of your sales forecasts.
- Seasonality: If your sales performance fluctuates heavily throughout certain periods, it’s important to take that into consideration. If your sales go through the roof every summer, there’s no use in comparing that quarter to the previous one. Instead, compare it to the same period of past years.
- Product Changes: The demand for your product, driven by its relevance, quality and value, will obviously impact your forecasting. If you’re forced to raise prices due to increased costs, you should keep an eye on how it affects the numbers. Likewise, the success of new product launches should be taken into account.
- Marketing Efforts: If you’re setting up a new campaign, changing how your email marketing works, or altering your advertising otherwise, your sales forecast should definitely know about it. It’s great if you’ve got previous examples to measure against, but you’ll most probably be applying qualitative techniques to measure the impact of these decisions.
- Industry and Economy Health: sales forecasts are concerned with how well an individual company will likely perform, but this doesn’t mean you shouldn’t look at larger industry trends and general economic conditions. Is your market growing? If so, have you noticed greater competition? A decent sales forecast needs to include this kind of information for context.
Generally speaking, the more external factors you’re aware of, and account for, the more accurate your sales forecasts can be. Identifying trends that influence your sales, whether they’re unique to your company or shared across the market, is critical for getting the details right.
9 Best Sales Forecasting Templates
To make accurate sales forecasts you need more than a balance sheet with cash flow data. You need a tool for each sales rep and sales manager to enter sales data and projections.
There’s lot of useful sales forecasting templates available online, but here are the 9 best examples as curated by us. Many of these templates are available for download in numerous formats (Excel, Google Sheets, PowerPoint) and have all of the formulas already inputted:
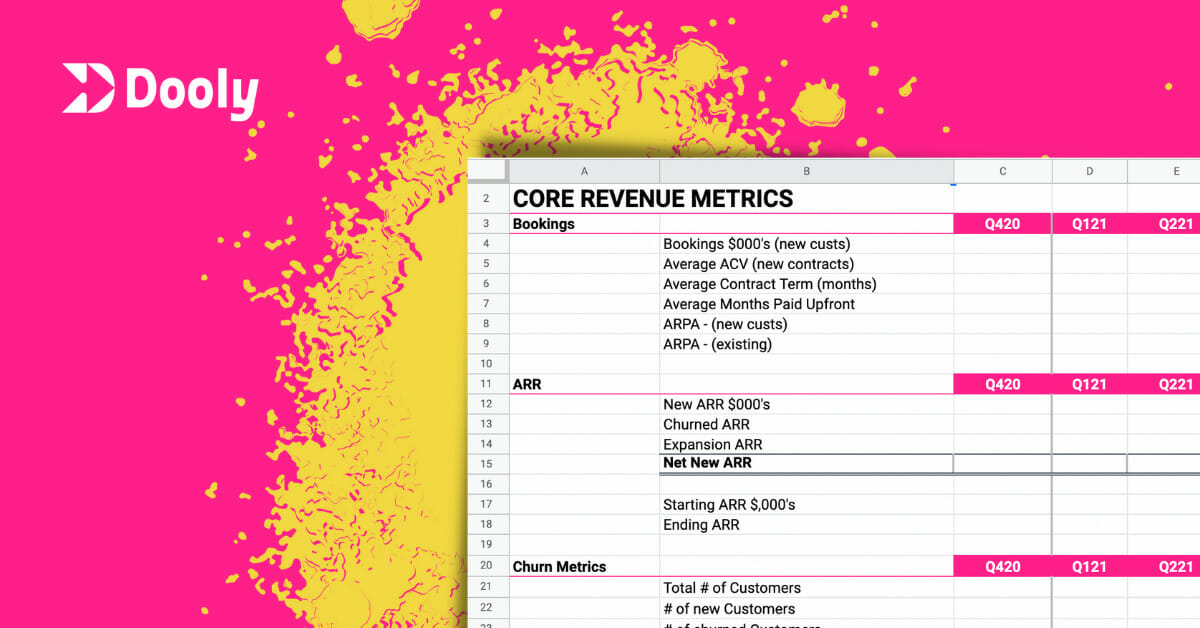
1. Dooly Sales Forecasting Template
This is the template our sales team uses at Dooly to make an accurate sales forecast. It tracks our core revenue metrics (bookings, ARR, churn, unit economics, financials, funnel metrics, and sales productivity). It also includes a 12-month ARR forecast template (Google sheet) that you can customize for the current year.
2. 3-year Forecast Template from Vertex42
This well-rounded template is a great place to start for annual overviews, allowing you to analyse several products by simply entering sales volume, unit price and costs. You can then see your total revenue, growth, and profit margin.
3. Budget Forecast Template from Smartsheet
This template can be used for all manner of scenarios, whether project specific or departmental. Presented with an attractive design with nice visual data, you can compare year-over-year figures with the provided metrics or your own.
4. Month-to-Month Forecast Template from TemplateArchive
These sales forecasting templates cover various kinds of sales forecasting, which applies to either short or long-term tracking. Some are more comprehensive than others, but you can read the guide for general tips no matter what your design.
5. 12-month Multiple Product Forecast Template from Smartsheet
This template gives you a yearly view of your catalogue, with space for historical sales, too. It’s impressively customizable, from product information to time periods, so you can easily identify the trends needed for reliable predictions.
6. Multi-product Forecast Template from TemplateArchive
This sales forecast template allows you to break down your estimates by individual product and see how they’re performing month by month. This is great for when you’ve launched numerous new products, or made big changes to your product list otherwise.
7. Retail Forecast Template from Smartsheet
This retail-specific template is well-suited for mapping out monthly sales and expenses, which includes things like advertising, payroll, and overhead. Simply add your customer numbers, sale per customer and cost per sale. Subtract your expenses and this template will formulate your total sales revenue, as well as gross and net profit.
8. Subscription-Based SaaS Forecast Template from PlanProjections
This template calculates subscription-based revenue, which is ideal for software as a service (SaaS) businesses. It allows you to compare year-on-year growth using metrics such as new sign-ups and paying customer churn. You can also use it to track number of visitors for making predictions on the scalability of your company.
9. B2B Lead Forecast Template from Microsoft
This sales forecasting template is a great example of opportunity stage forecasting, letting you record such information as the sales agent, forecast amount and sales phase. This template relies on weighted forecasts, based on the likelihood of closing each opportunity.
Key Takeaways on Sales Forecasting
Sales Forecasts aren’t just for appeasing the board. They’re critical for the decision-making process, giving a company the insight they need to avoid pitfalls and take the best courses of action. At the same time, they act as motivation for sales managers and reps, giving everyone a clear goal to work towards.
The fact that there are so many sales forecasting templates available gives you some indication that plenty of people struggle with creating them. You only need to remember that the value of a forecast hinges on its accuracy. Collecting data isn’t exactly glamorous, but when you’re dealing with your sales figures, it’s as trendy as you like.
How Dooly Can Help with Sales Forecasting
Sales leaders always tell us that due to bad note taking or sales hygiene they struggle to forecast accurately.
Dooly can help you be confident in your pipeline. Dooly makes it easy for sellers to update their pipeline in real-time so you always have an accurate forecast. Curious how it works? See Dooly in action.
Join the thousands of top-performing AEs who use Dooly every day to stay more organized, instantly update their pipeline, and spend more time selling instead of mindless admin work. Try Dooly free, no credit card required. Or, Request a demo to speak with a Dooly product expert right now.